Basic Terminology#
There are four key concepts that we need to understand in order to grasp the fundamentals of statistics:
Data: Refers to measurements or, more generally, to documented observations gathered through an experiment or phenomenon.
Experimental unit (or unit of analysis): In statistics, this refers to the individual element or entity that is the subject of analysis in a statistical study. These units serve as the fundamental components from which data is collected and analyzed.
Response variable: A characteristic of interest observed in the experimental unit, which is susceptible to being quantified or recorded in any form, not necessarily in numerical terms.
Statistical population: The totality of values for a response variable across the entire population under study.
1. Population vs. Sample#
In a perfect world environment, we would love to understand all study units. However, in the real world, this is often not possible. With this in mind, we distinguish between population and sample as follows:
Population: The entire group of individuals or observations that you want to study. Studying the entire population is often impractical due to its size and complexity.
Sample: A subset of the population selected for analysis. Samples are used to make inferences about the population, provided they are representative.
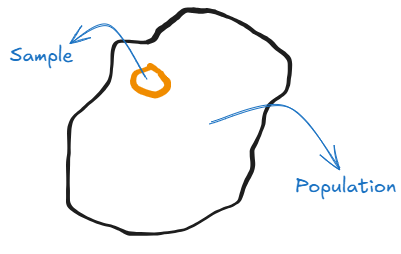
Example:
Population: All customers of an e-commerce website.
Sample: 1,000 customers selected randomly from the website’s database.
Why Use a Sample?#
For practical reasons:
Studying the entire population is often impractical or impossible.
Accessibility issues may prevent studying the entire population.
Sampling is faster, more cost-effective, and easier to analyze.
The size of the population relative to the sample is not always the most critical factor; what matters most is that the sample is selected randomly and is representative of the population to ensure valid conclusions.
📝 Exercises for Practice#
1. Multiple Choice Questions
Which of the following best describes a population?
A) A group of randomly selected individuals used for analysis
B) The entire group of individuals or observations you want to study
C) A subset of individuals chosen from a group
D) The statistical summary of a dataset
Answer: B
What is the primary purpose of using a sample instead of a population?
A) It is more representative
B) It provides exact data without errors
C) It is often more practical and cost-effective
D) It always gives the same results as the population
Answer: C
Which of the following factors is most important when selecting a sample?
A) Its representativeness
B) Its size relative to the population
C) The convenience of collecting data
D) The number of data points collected
Answer: A
2. True or False
A sample always provides the same results as the population.
FalseThe entire customer base of an online store is an example of a population.
TrueSampling is often more cost-effective and easier to analyze than studying the entire population.
TrueThe size of the population relative to the sample is always the most critical factor in ensuring valid conclusions.
False
3. Short Answer Questions
What are the key differences between a population and a sample?
Why is it impractical to study an entire population in most cases?
Provide an example of a population and a corresponding sample in the context of healthcare.
What makes a sample representative of a population?
Why is randomness important in selecting a sample?
Identify the Population and Sample in the following scenarios:
A survey is conducted to determine the favorite type of coffee among 1,000 randomly selected customers at a coffee shop chain.
A study measures the weight of 50 apples selected from a shipment of 10,000 apples.
4. Application-Based Questions
A university wants to analyze student satisfaction with campus facilities. The total student population is 20,000. If they survey 500 randomly selected students, what is the population, and what is the sample?
A marketing team wants to understand customer preferences for a new product line. They send a survey to 2,000 customers selected from a database of 50,000. What steps should they take to ensure their sample is representative?
Suppose you are conducting a study on the eating habits of teenagers in your city. What challenges might you face in studying the entire population, and how can sampling help?
5. Critical Thinking Exercise
Consider the following scenario:
A researcher wants to determine the average income of people in a large metropolitan area. They survey 1,000 randomly chosen residents from different neighborhoods.
What potential biases could affect the sample?
How can the researcher ensure the sample is representative of the population?
What could be the consequences of using a non-representative sample in drawing conclusions?
2. Bias and Bias Types#
Bias refers to systematic errors in data collection, analysis, interpretation, or presentation that can lead to inaccurate conclusions. It can occur at any stage of a statistical study and can significantly impact the validity of results.
Why is Bias Important?#
Bias can distort findings and lead to incorrect conclusions.
Understanding bias helps ensure the reliability and credibility of research.
Identifying and minimizing bias improves the quality of decision-making based on data.
Common Types of Bias#
Selection Bias:
Occurs when the sample chosen for analysis does not accurately represent the target population. This can result in over- or under-representation of certain groups.Example: Conducting a survey only among social media users to assess overall public opinion.
Self-Selection Bias:
A special type of selection bias that happens when individuals choose to participate in a study based on their interest, motivation, or other personal characteristics.Example: An online survey about health habits might attract health-conscious individuals, leading to skewed results.
Sampling Bias:
A subset of selection bias where certain members of the population are more likely to be included in the sample than others.Example: Conducting a phone survey that excludes people without landlines.
Measurement Bias (or Information Bias):
Arises when data collection methods systematically misrepresent the actual values.Example: A faulty scale consistently under-reporting weight measurements.
Response Bias:
Occurs when participants provide inaccurate or false responses due to social desirability, misunderstanding, or survey design.Example: People underreporting alcohol consumption in surveys.
Confirmation Bias:
The tendency to interpret data in a way that confirms pre-existing beliefs or hypotheses.Example: A researcher focusing only on data that supports their hypothesis and ignoring contradictory evidence.
Observer Bias:
Happens when researchers subconsciously influence the outcome of an experiment based on their expectations.Example: A doctor interpreting a patient’s symptoms based on their preconceived notion of the diagnosis.
Publication Bias:
The tendency for journals to publish only positive or significant results, leading to a skewed understanding of research outcomes.Example: Studies showing no effect of a treatment are less likely to be published.
Survivorship Bias:
Occurs when only successful cases are considered, ignoring those that failed or were excluded.Example: Studying successful companies without analyzing those that went bankrupt.
Recall Bias:
When participants fail to accurately remember past events, leading to skewed data.Example: Patients inaccurately recalling their diet habits in a nutritional study.
How to Minimize Bias#
Use random sampling to ensure representativeness.
Apply blinding techniques in experiments to reduce observer bias.
Use standardized data collection methods to minimize measurement errors.
Conduct pilot studies to identify potential biases early.
Be aware of personal biases and use objective analysis methods.
Example Scenario#
Imagine a company conducting a customer satisfaction survey but only selecting participants from their loyalty program.
Potential Bias: Selection bias (loyal customers may have a more positive perception).
Solution: Randomly sample customers from all segments to get a balanced view.
📝 Exercises for Practice#
1. Multiple Choice Questions
Which of the following is an example of selection bias?
A) Using a random sampling method to collect data.
B) Surveying only college students about national political opinions.
C) Collecting data using a precise measuring instrument.
D) Publishing research with negative results.
Answer: B
Measurement bias occurs when:
A) The sample does not represent the entire population.
B) Participants provide inaccurate answers.
C) The data collection tool consistently misrepresents data.
D) The researcher influences the results subconsciously.
Answer: C
2. True or False
Selection bias occurs when the data collection tool misrepresents values.
FalseRandom sampling helps in reducing selection bias.
TrueSurvivorship bias occurs when we analyze only successful cases and ignore failures.
True
3. Short Answer Questions
Define and provide an example of confirmation bias.
What steps can be taken to reduce response bias in a survey?
Explain how publication bias can affect scientific knowledge.
Why is it important to minimize bias in data analysis?
4. Application-Based Questions
A health researcher collects data from patients in a single hospital to estimate national health trends. What type of bias might this introduce, and how can it be mitigated?
A company collects performance feedback from employees who volunteer to participate. What type of bias may be present, and what could be done to avoid it?
How can survivorship bias affect investment decisions when analyzing successful companies?
5. Critical Thinking Exercise
Consider a situation where a social media platform analyzes user engagement by looking only at active users.
What bias might be affecting their analysis?
How could they improve their data collection to gain a more accurate understanding?
What are the potential consequences of ignoring inactive users in their analysis?
Python Usage Examples#
Python can help identify and address bias in datasets through statistical analysis and visualization.
import pandas as pd
import seaborn as sns
import matplotlib.pyplot as plt

# Sample biased dataset (survey from social media users)
data = {
    "Age": [18, 22, 25, 35, 45, 50, 60, 65],
    "Income": [20000, 25000, 30000, 50000, 70000, 75000, 80000, 85000],
    "Survey_Source": ["Social Media", "Social Media", "Social Media", "Direct Mail", "Direct Mail", "Direct Mail", "Newspaper", "Newspaper"]
}

df = pd.DataFrame(data)

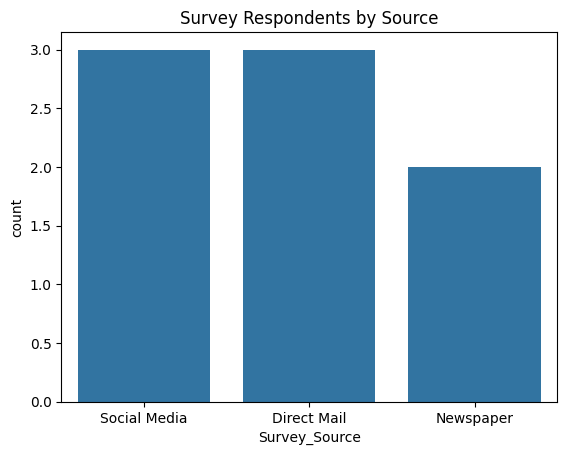
# Check representation by source
sns.countplot(
    x="Survey_Source",
    data=df
)
plt.title("Survey Respondents by Source")
plt.show()

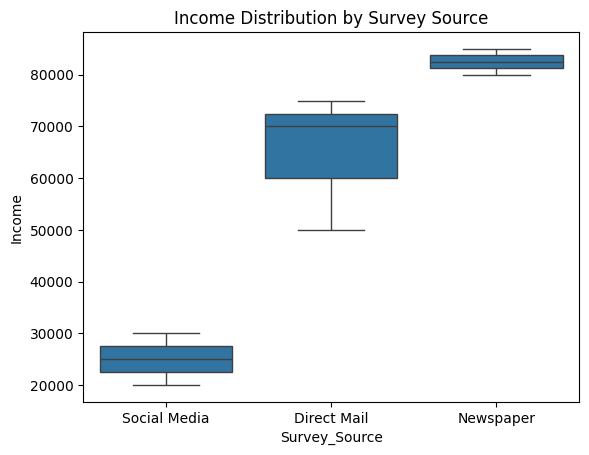
# Analyze potential bias by income levels
sns.boxplot(
    x="Survey_Source",
    y="Income",
    data=df
)
plt.title("Income Distribution by Survey Source")
plt.show()

# Solution: Resampling techniques or weighting methods
from sklearn.utils import resample

# Oversample underrepresented groups
df_balanced = resample(
    df[df["Survey_Source"] != "Social Media"],
    replace=True,
    n_samples=3,
    random_state=42
)
df_final = pd.concat(
    [df[df["Survey_Source"] == "Social Media"],
     df_balanced]
)

pd.DataFrame(df_final["Survey_Source"].value_counts())
---------------------------------------------------------------------------
ModuleNotFoundError                       Traceback (most recent call last)
Cell In[1], line 32
     29 plt.show()
     31 # Solution: Resampling techniques or weighting methods
---> 32 from sklearn.utils import resample
     34 # Oversample underrepresented groups
     35 df_balanced = resample(
     36     df[df["Survey_Source"] != "Social Media"],
     37     replace=True,
     38     n_samples=3,
     39     random_state=42
     40 )

ModuleNotFoundError: No module named 'sklearn'
Tasks to Try:
Analyze the impact of selection bias by introducing another source of respondents.
Use random sampling methods to reduce bias in a given dataset.
Perform hypothesis testing to check for differences across biased and unbiased groups.
# your answers here
3. Descriptive vs. Inferential statistics#
Statistics can be used to either describe a population or sample (descriptive statistics) or to make generalizations and predictions about a population based on a sample (inferential statistics). The differences are as follows:
1. Definition and Purpose#
Aspect |
Descriptive statistics |
Inferential statistics |
|---|---|---|
Definition |
Summarizes and describes the main features of a dataset. |
Uses sample data to make inferences or predictions about a larger population. |
Purpose |
To organize, summarize, and present data in a clear and understandable way. |
To make inferences and draw conclusions about a population from a sample using probability theory. |
Focus |
Presentation and visualization of data. |
Analyzing data to make predictions or test hypotheses. |
2. Techniques Used#
Aspect |
Descriptive statistics |
Inferential statistics |
|---|---|---|
Techniques |
Measures of central tendency (mean, median, mode), dispersion (range, variance, standard deviation), and visualization (charts, tables). |
Estimation (confidence intervals), hypothesis testing (t-tests, chi-square tests), and regression analysis. |
Example Methods |
Frequency distributions, percentages, histograms, pie charts. |
t-tests, ANOVA, regression analysis, and p-values. |
3. Data Scope#
Aspect |
Descriptive statistics |
Inferential statistics |
|---|---|---|
Scope |
Describes observed data only (e.g., survey results). |
Draws conclusions beyond observed data to a larger population. |
Use Case |
Summarizing exam scores for a class. |
Predicting the performance of all students based on a sampled group. |
Example#
Parameter: The population mean (μ) or population standard deviation (σ).
Statistic: The sample mean (x̄) or sample standard deviation (s).
Why do we use it?#
Studying the entire population is often impractical or impossible.
Sampling is faster, more cost-effective, and easier to analyze.
📝 Exercises for Practice#
1. Multiple Choice Questions
What is the primary purpose of descriptive statistics?
A) To make predictions about a population
B) To test hypotheses using sample data
C) To summarize and describe the main features of a dataset
D) To analyze relationships between variables
Answer: C
Which of the following is an example of inferential statistics?
A) Calculating the average age of students in a class
B) Creating a bar chart to display sales data
C) Using a sample to estimate the average income of a country’s population
D) Measuring the range of exam scores in a dataset
Answer: C
Which statistical technique is commonly used in descriptive statistics?
A) Hypothesis testing
B) Confidence intervals
C) Frequency distributions
D) Regression analysis
Answer: C
Which of the following best describes inferential statistics?
A) It focuses on organizing and summarizing data
B) It is used to make conclusions about an entire population based on a sample
C) It provides exact values for entire datasets
D) It is only used in exploratory data analysis
Answer: B
2. True or False
Descriptive statistics can help us predict trends in future data.
FalseInferential statistics rely on probability theory to make generalizations about a population.
TrueMeasures such as mean, median, and mode are part of inferential statistics.
FalseSampling is often used in inferential statistics to analyze large populations efficiently.
True
3. Short Answer Questions
What is the main difference between descriptive and inferential statistics?
Provide an example where descriptive statistics would be more useful than inferential statistics.
Why is sampling important in inferential statistics?
How does inferential statistics help businesses make data-driven decisions?
List two techniques used in inferential statistics and explain their purpose.
4. Application-Based Questions
A school wants to analyze students’ exam scores to understand overall performance. Would descriptive or inferential statistics be more appropriate? Explain your answer.
A company surveys 500 customers out of 10,000 total customers to determine satisfaction levels. Which type of statistics should they use to generalize the results to all customers?
If a research team wants to determine whether a new drug is effective by testing it on a group of 1,000 patients, which type of statistics should be applied, and why?
Suppose you conducted a survey of 200 people to estimate the average daily coffee consumption of all office workers in your city. What kind of statistical approach would you use, and what steps should you take to ensure reliable results?
5. Critical Thinking Exercise
Consider the following scenario:
A market research team collected sales data from 50 stores to estimate the sales performance of a newly launched product across the entire country.
What challenges might they face in making accurate inferences?
How can they ensure that their sample is representative of the entire population?
Why is it important to use inferential statistics instead of relying only on descriptive statistics?
4. Parameters vs. Statistics#
To better understand inferential statistics, it is important to distinguish between a parameter and a statistic.
1. Definition and Differences#
Aspect |
Parameter |
Statistic |
|---|---|---|
Definition |
A numerical value that describes a characteristic of an entire population. |
A numerical value that describes a characteristic of a sample, which is a subset of the population. |
Scope |
Refers to the whole population (e.g., all customers of a company). |
Based on a subset of the population (e.g., a survey of 1,000 customers). |
Symbol |
Greek letters (e.g., \(\mu\) for mean, \(\sigma\) for standard deviation, \(P\) for proportion). |
Latin letters (e.g., \(\bar{x}\) for sample mean, \(s\) for sample standard deviation, \(\hat{p}\) for sample proportion). |
Variability |
Fixed and constant (but often unknown). |
Varies from sample to sample (used to estimate parameters). |
Example |
The average height of all adults in a country (\(\mu\)). |
The average height of a surveyed group of 1,000 adults (\(\bar{x}\)). |
2. Key Concepts#
Parameters:#
Describe the entire population, which is usually impractical or impossible to measure directly.
They are fixed values but often unknown, and we rely on estimates from sample data.
Statistics:#
Derived from sample data and used to estimate the unknown parameters.
Since samples vary, statistics are subject to sampling variability, which leads to the need for confidence intervals and hypothesis testing.
3. Relationship Between Parameters and Statistics#
Inferential statistics aim to use sample statistics to estimate population parameters.
Example:
The sample mean (\(\bar{x}\)) can be used as an estimate of the population mean (\(\mu\)).
The larger and more representative the sample, the closer the statistic will be to the true parameter.
4. Practical Example#
Suppose you want to know the average income of all employees in a company:
Parameter (\(\mu\)): The true average income of all employees (e.g., $50,000 per year).
Statistic (\(\bar{x}\)): The average income based on a sample of 100 employees (e.g., $48,500 per year).
If the sample is representative and random, we can infer that the population average income is approximately $50,000.
5. Importance of the Distinction#
Knowing whether you’re dealing with a statistic or a parameter helps in:
Understanding the reliability of conclusions.
Designing proper sampling methods.
Calculating confidence intervals and margins of error.
Avoiding biases in data interpretation.
📝 Exercises for Practice#
1. Multiple Choice Questions
What is the key difference between a parameter and a statistic?
A) A parameter describes a sample, while a statistic describes a population.
B) A parameter describes a population, while a statistic describes a sample.
C) Parameters are more variable than statistics.
D) Parameters and statistics are always equal in value.
Answer: B
Which of the following symbols typically represents a parameter?
A) \(\bar{x}\)
B) \(s\)
C) \(\mu\)
D) \(\hat{p}\)
Answer: C
Which of the following statements is true regarding statistics?
A) They are fixed values.
B) They are subject to sampling variability.
C) They always represent the entire population.
D) They are unknown and cannot be estimated.
Answer: B
If a researcher collects data from a random sample of 500 customers to estimate the average satisfaction of all customers, the sample mean is considered:
A) A parameter
B) A statistic
C) A population
D) A variable
Answer: B
2. True or False
A population parameter is always an exact known value.
FalseA sample statistic is used to estimate a population parameter.
TrueA sample statistic can vary depending on the sample selected.
TrueThe symbol \(\bar{x}\) represents a population mean.
False
3. Short Answer Questions
Define the difference between a parameter and a statistic with an example.
Why are parameters often unknown in real-world studies?
What are some common symbols used to represent parameters and statistics?
Why is it important to use representative samples when estimating population parameters?
Explain the concept of sampling variability and why it affects statistics.
4. Application-Based Questions
A company wants to determine the average productivity of its employees. They survey 200 employees out of 5,000.
What is the population in this scenario?
What is the sample?
What is the sample statistic they might calculate?
Suppose you are a researcher trying to estimate the average lifespan of a species of bird in the wild.
Why is it impractical to measure the lifespan of every bird?
What steps can you take to ensure your sample is representative?
A government agency collects data on household income in a city by surveying 1,000 randomly selected households.
What challenges might they face in ensuring that their sample accurately represents the city’s population?
How can inferential statistics help them draw conclusions?
5. Critical Thinking Exercise
A pharmaceutical company is testing the effectiveness of a new drug. They administer the drug to 1,000 patients out of a total population of 10,000 patients.
Identify the population and sample in this study.
Explain how inferential statistics would be used to make conclusions about the drug’s effectiveness for the entire population.
Discuss potential sources of bias that could affect the accuracy of the sample statistic.
5. Types of Data#
Data can be classified into various types based on its nature. Understanding these types helps in selecting the appropriate statistical techniques for analysis.
1. Categorical Data#
Categorical data represents characteristics that describe attributes or qualities rather than numerical values.
Key Features: Categories with no inherent numerical value or order.
Examples: Gender (Male, Female), Eye Color (Brown, Blue, Green), Car Brands (Toyota, Ford, BMW).
2. Numerical Data#
Numerical data represents quantifiable measurements and can be further divided into:
Discrete:
Represents countable values with no intermediate values.Examples: Number of students in a class, number of cars in a parking lot.
Continuous:
Represents measurable values that can take any value within a range.Examples: Height, Weight, Temperature.
3. Ordinal Data#
Ordinal data represents categories with a meaningful order; however, the differences between values are not necessarily equal or meaningful.
Key Features: Order matters, but exact differences are not quantifiable.
Examples: Education Level (High School, Bachelor’s, Master’s, PhD), Customer Satisfaction (Low, Medium, High), Movie Ratings (1 star, 2 stars, etc.).
4. Interval Data#
Interval data consists of numerical values with equal intervals between them but lacks a true zero point.
Key Features: Allows meaningful comparison of differences, but not ratios.
Examples: Temperature in Celsius or Fahrenheit, IQ scores, Dates in a calendar.
5. Ratio Data#
Ratio data is similar to interval data but includes a true zero point, making ratio comparisons meaningful.
Key Features: Allows comparisons such as “twice as much.”
Examples: Age, Income, Weight, Height, Distance.
6. Time Series Data#
Time series data consists of observations collected at successive time intervals, often used for trend analysis and forecasting.
Key Features: Data is recorded over time, usually at consistent intervals.
Examples: Daily stock prices, monthly sales data, hourly weather records, annual revenue figures.
📝 Exercises for Practice#
1. Multiple Choice Questions
Which of the following is an example of categorical data?
A) Number of students in a class
B) Eye color (Brown, Blue, Green)
C) Temperature in Celsius
D) Monthly sales data
Answer: B
Which type of data allows meaningful ratio comparisons and has a true zero point?
A) Ordinal
B) Interval
C) Ratio
D) Categorical
Answer: C
Time series data is characterized by:
A) A true zero point
B) Data recorded at successive time intervals
C) Categories without an inherent order
D) Discrete values only
Answer: B
Which of the following is an example of ordinal data?
A) Exam scores in percentages
B) Education levels (High School, Bachelor’s, Master’s, PhD)
C) Eye color categories
D) Monthly income levels
Answer: B
2. True or False
Categorical data consists of numerical values with meaningful order.
FalseDiscrete numerical data can take any value within a range.
FalseTime series data always follows a regular time interval pattern.
TrueRatio data has a true zero point and allows for meaningful ratio comparisons.
True
3. Short Answer Questions
What are the key differences between interval data and ratio data?
Provide two examples of categorical data and explain why they fall under this category.
How does ordinal data differ from nominal data?
Why is it important to distinguish between discrete and continuous numerical data?
What type of data would you collect to analyze the performance of an athlete over a season?
Classify the following variables into Categorical, Numerical (Discrete/Continuous), Ordinal, Interval, Ratio, or Time Series:
Marital Status (Single, Married, Divorced)
Age
Satisfaction Rating (1 to 5)
Monthly Salary
Temperature in Fahrenheit
Daily Website Traffic (Visits Per Day)
4. Application-Based Questions
A hospital records patient temperature every hour. What type of data is being collected, and why?
If you survey 1,000 people about their preferred car brands, what type of data would this be classified as?
A researcher is studying the impact of exercise time on weight loss progress over months. What type of data does this represent?
Identify the types of data in the following scenario:
A retail company tracks monthly sales revenue.
A school records students’ grades (A, B, C, etc.).
A researcher tracks the age of participants in a study.
How would you classify the following data types in a sports competition:
Athlete rankings
Time taken to complete a race
Types of medals won (gold, silver, bronze)
5. Critical Thinking Exercise
Consider the following scenario:
A government agency wants to analyze employment trends by collecting data on age, gender, job position, income, and years of experience.
Identify the type of data for each attribute.
Explain why it is important to classify data correctly before analysis.
Discuss how the agency can use descriptive and inferential statistics based on the data collected.
6. Python Usage Examples
You can analyze and classify data types using Python. Try the following code snippets:
import pandas as pd
import numpy as np

# Sample Data
data = {
    "Gender": ["Male", "Female", "Female", "Male"],  # Categorical
    "Age": [25, 30, 22, 28],  # Ratio
    "Education_Level": ["High School", "Bachelor's", "Master's", "PhD"],  # Ordinal
    "Temperature_C": [36.5, 37.2, 36.8, 37.0],  # Interval
    "Monthly_Income": [4000, 5500, 3200, 5000],  # Ratio
    "Customer_Rating": [3, 5, 4, 2],  # Ordinal
    "Sales_Date": pd.date_range(start="2023-01-01", periods=4, freq='ME')  # Time Series
}

print("We can also check data types:",df.dtypes)

df = pd.DataFrame(data)

# Convert ordinal data to ordered category
education_levels = ["High School", "Bachelor's", "Master's", "PhD"]
df["Education_Level"] = pd.Categorical(df["Education_Level"], categories=education_levels, ordered=True)

# Display data
print(df)

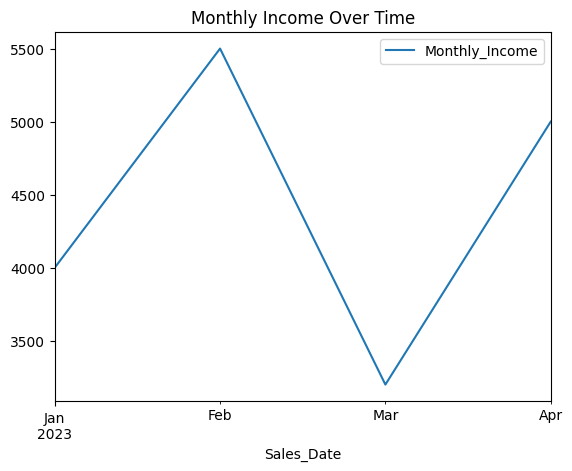
# Plot time series data
print("Or plot time series data:")
df.plot(
    x="Sales_Date",
    y="Monthly_Income",
    kind="line",
    title="Monthly Income Over Time"
)
   Gender  Age Education_Level  Temperature_C  Monthly_Income  \
0    Male   25     High School           36.5            4000
1  Female   30      Bachelor's           37.2            5500
2  Female   22        Master's           36.8            3200
3    Male   28             PhD           37.0            5000

   Customer_Rating Sales_Date
0                3 2023-01-31
1                5 2023-02-28
2                4 2023-03-31
3                2 2023-04-30
<Axes: title={'center': 'Monthly Income Over Time'}, xlabel='Sales_Date'>
Tasks to Try:
Modify the dataset by adding discrete and continuous numerical data.
Write code to filter categorical or numerical data from the DataFrame.
Use descriptive statistics functions to summarize the numerical data.
Create visualizations for different data types using Matplotlib or Seaborn.
# Your answers here
6. Levels of measurement#
Understanding the levels of measurement is crucial for selecting the appropriate statistical methods and analyses. Different data types allow for different types of statistical operations and interpretations.
Nominal: Categories with no inherent order; used for classification or labeling purposes.
Examples: Gender (Male, Female), Eye color (Brown, Blue, Green), Car brands (Toyota, Ford, BMW).
Ordinal: Ordered categories, but the differences between them are not uniform or meaningful.
Examples: Education levels (High School, Bachelor’s, Master’s, PhD), Customer satisfaction (Low, Medium, High).
Interval: Ordered and measurable intervals, but with no true zero point.
Examples: Temperature in Celsius or Fahrenheit, IQ scores, Dates on a calendar.
Ratio: Ordered, measurable intervals with a true zero point, allowing for meaningful ratio comparisons.
Examples: Age, Income, Weight, Height.
Example: Classifying Data#
Suppose you are analyzing data from a fitness app that tracks user information:
Nominal: User’s favorite workout type (Yoga, Cardio, Strength Training)
Ordinal: Fitness level (Beginner, Intermediate, Advanced)
Interval: Temperature during the workout (in Celsius)
Ratio: Number of calories burned during the session
Why is it important?#
Different levels of measurement allow for different types of statistical operations.
Example: You cannot calculate a mean for nominal data (e.g., colors: “red,” “blue”) but can for interval or ratio data (e.g., temperature, height).
Helps in selecting the appropriate statistical test.
Selecting the appropriate level of measurement is essential for applying the correct statistical techniques.
📝 Exercises for Practice#
1. Multiple Choice Questions
Which of the following is an example of nominal data?
A) Temperature in Celsius
B) Customer satisfaction (Low, Medium, High)
C) Eye color (Brown, Blue, Green)
D) Age
Answer: C
What distinguishes ordinal data from nominal data?
A) Ordinal data has a true zero point
B) Ordinal data has a meaningful order but not equal differences
C) Ordinal data allows ratio comparisons
D) Ordinal data consists only of numbers
Answer: B
Which level of measurement allows meaningful ratio comparisons?
A) Nominal
B) Ordinal
C) Interval
D) Ratio
Answer: D
IQ scores are an example of which level of measurement?
A) Nominal
B) Ordinal
C) Interval
D) Ratio
Answer: C
Which of the following levels of measurement lacks a true zero point?
A) Ratio
B) Interval
C) Ordinal
D) Nominal
Answer: B
2. True or False
Nominal data can be ranked in a meaningful order.
FalseOrdinal data can be used for calculating averages.
FalseInterval data allows meaningful differences but lacks a true zero.
TrueRatio data supports meaningful comparisons such as “twice as much.”
TrueDates on a calendar represent ratio data.
False
3. Short Answer Questions
Define the four levels of measurement and provide an example for each.
Why is it important to identify the correct level of measurement in statistical analysis?
How does the presence of a true zero point differentiate ratio data from interval data?
In what situations would ordinal data be more useful than nominal data?
Give an example of how an incorrect level of measurement classification could impact data analysis.
4. Application-Based Questions
A hospital collects data on patient recovery times, gender, and pain levels rated on a scale of 1-10. Identify the level of measurement for each type of data.
A company records employee ID numbers, their department, and monthly salaries. Classify each under the appropriate level of measurement.
A weather agency records daily high temperatures. What level of measurement does this data belong to, and why?
An education researcher collects data on students’ test scores and their favorite school subjects. How should this data be classified?
A retail store tracks customer feedback with ratings of “Poor,” “Fair,” “Good,” and “Excellent.” What level of measurement is this, and how should it be analyzed?
5. Critical Thinking Exercise
Consider the following scenario:
A fitness company collects the following data from its users:
Workout type (Yoga, Cardio, Strength Training)
Number of calories burned
Satisfaction rating (Low, Medium, High)
Time spent exercising (in minutes)
Questions to discuss:
Classify each type of data into the appropriate level of measurement.
Why is it important to classify data correctly in this scenario?
What types of statistical methods could be applied to analyze each type of data?
How could misclassifying the data affect business decisions for the company?
6. Python Usage Examples
You can classify and analyze different types of data using Python. Below is an example:
import pandas as pd

# Sample dataset with different levels of measurement
data = {
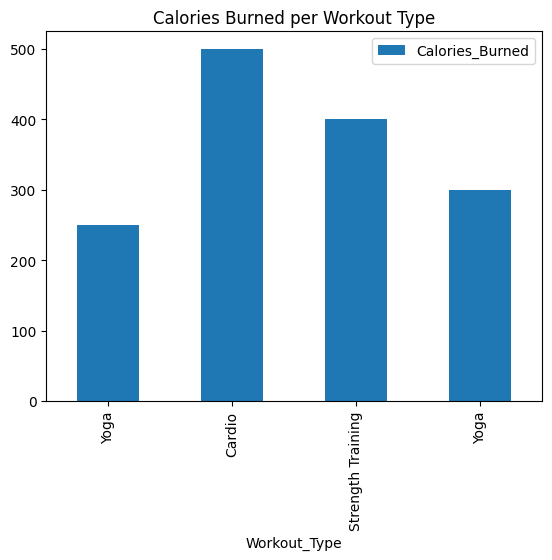
    "Workout_Type": ["Yoga", "Cardio", "Strength Training", "Yoga"],  # Nominal
    "Satisfaction_Level": ["Low", "Medium", "High", "Medium"],  # Ordinal
    "Calories_Burned": [250, 500, 400, 300],  # Ratio
    "Temperature": [22.5, 24.0, 23.5, 25.0]  # Interval
}

# Create a DataFrame
df = pd.DataFrame(data)

# Convert ordinal data to an ordered category
satisfaction_levels = ["Low", "Medium", "High"]
df["Satisfaction_Level"] = pd.Categorical(df["Satisfaction_Level"], categories=satisfaction_levels, ordered=True)

# Display data types
print(df.dtypes)

# Basic descriptive analysis
print("Average calories burned:", df["Calories_Burned"].mean())

# Visualizing numerical data
df.plot(
    x="Workout_Type",
    y="Calories_Burned",
    kind="bar",
    title="Calories Burned per Workout Type"
)
Workout_Type            object
Satisfaction_Level    category
Calories_Burned          int64
Temperature            float64
dtype: object
Average calories burned: 362.5
<Axes: title={'center': 'Calories Burned per Workout Type'}, xlabel='Workout_Type'>
Tasks to Try:
Modify the dataset by adding another nominal and ratio variable.
Convert the “Workout_Type” column into categorical data.
Perform statistical calculations on ratio and interval data.
Create a scatter plot comparing calories burned and temperature.
7. Variables#
Variables are fundamental elements in research and data analysis, representing characteristics that can change or vary across different observations.
Independent variable:
The variable that is manipulated or categorized to observe its effect on the dependent variable.Examples: Amount of study time (in hours), type of fertilizer used, different marketing strategies.
Dependent variable:
The variable that is measured or observed to assess the effect of the independent variable.Examples: Exam scores, plant growth, sales revenue.
Confounding variable: A confounding variable is a third variable that affects both the independent variable (IV) and the dependent variable (DV), potentially distorting or masking the true relationship between them. In other words, a confounder creates a false association or hides a real effect, leading to misinterpretation of causal relationships in statistical analysis.
Example: Ice Cream & Drowning Deaths
Observation: Higher ice cream sales are associated with more drowning deaths.
Does this mean eating ice cream causes drowning? ❌ No.
Confounding Variable: Temperature (Season)
When it’s hot, ice cream sales increase.
When it’s hot, more people go swimming, leading to more drownings.
The true cause of drowning is not ice cream sales, but the hot weather.
Why Do Confounding Variables Matter?#
They Can Create False Causal Relationships
If confounders are ignored, you may mistakenly conclude that one variable affects another.
They Can Hide True Relationships
A confounder might make an actual relationship appear weaker or nonexistent.
They Affect Experiment & Study Validity
In scientific studies, failing to account for confounders leads to biased results.
How to Handle Confounding Variables?#
Randomization: In experiments, randomly assigning participants helps distribute confounders evenly.
Statistical Control: Use regression analysis to adjust for confounders.
Matching: Ensure groups being compared have similar levels of the confounding variable.
Stratification: Analyze data within subgroups where the confounder is constant.
Example in research:#
If we are studying the effect of study time on exam performance:
Independent Variable: Study time (in hours).
Dependent Variable: Exam scores.
Why is it important?#
Understanding the relationship between variables helps in designing experiments and analyzing results effectively.
Identifying independent and dependent variables allows researchers to determine causality.
Incorrect classification can lead to false assumptions.
Example: Saying customer satisfaction (DV) influences product price (IV) would be incorrect. Price influences satisfaction, not the other way around.
Helps in designing experiments and A/B testing:
In clinical trials: New drug (IV) -> Blood pressure reduction (DV).
In business analytics: Discount offered (IV) -> Customer purchase behavior (DV).
Confounding variables are hidden influencers that can mislead analysis. Recognizing and controlling for them is crucial for accurate research, data science, and business decisions.
📝 Exercises for Practice#
1. Multiple Choice Questions
Which of the following is an example of an independent variable?
A) Exam scores
B) Study time (in hours)
C) Sales revenue
D) Plant growth
Answer: B
In an experiment to test the effect of a new fertilizer on plant growth, which is the dependent variable?
A) Amount of fertilizer used
B) Type of plant
C) Plant growth
D) Soil type
Answer: C
Why is it important to identify independent and dependent variables in research?
A) To reduce sample size
B) To establish causality and analyze relationships
C) To eliminate bias
D) To avoid statistical tests
Answer: B
Which of the following represents a correct pair of independent and dependent variables?
A) Advertising budget (Independent), Product sales (Dependent)
B) Employee satisfaction (Independent), Number of marketing campaigns (Dependent)
C) Customer age (Independent), Employee turnover (Dependent)
D) Hours worked (Dependent), Employee salary (Independent)
Answer: A
2. True or False
The dependent variable is the variable that is manipulated in an experiment.
FalseAn independent variable is the factor that influences changes in the dependent variable.
TrueIn a study analyzing the impact of social media usage on sleep quality, sleep quality is the dependent variable.
TrueResearchers can manipulate dependent variables to observe changes in independent variables.
False
3. Short Answer Questions
Define independent and dependent variables and provide an example of each.
Why is it crucial to identify the dependent variable in a research study?
How can confounding variables impact the relationship between independent and dependent variables?
Provide a real-life example where identifying independent and dependent variables is critical for decision-making.
In a study investigating the effect of advertising spend on sales, what variables would you classify as independent and dependent?
4. Application-Based Questions
A fitness trainer wants to analyze the effect of different workout routines on weight loss. Identify the independent and dependent variables in this scenario.
A company wants to study the impact of price discounts on customer purchase behavior. How should the variables be classified?
A scientist is studying the impact of water temperature on fish swimming speed. What are the independent and dependent variables?
In a marketing campaign, researchers measure the effect of different ad formats on click-through rates. Identify the variables.
An educator is studying the relationship between student attendance and exam performance. How should they classify their variables?
5. Critical Thinking Exercise
Consider the following scenario:
A pharmaceutical company is testing the effectiveness of a new drug in lowering blood pressure. They recruit 1,000 patients and randomly assign them to either a placebo or drug treatment group. After eight weeks, they measure the patients’ blood pressure levels.
Questions to discuss:
Identify the independent and dependent variables in this study.
What factors could act as confounding variables?
How could randomization help ensure valid results?
What statistical techniques could be used to analyze the relationship between the variables?
How might the company ensure that the sample used is representative of the larger population?
6. Python Usage Examples
You can analyze and visualize relationships between independent and dependent variables using Python. Try the following code snippets:
import pandas as pd
import matplotlib.pyplot as plt
import seaborn as sns

# Sample dataset: Study time (independent) vs. Exam scores (dependent)
data = {
    "Study_Hours": [1, 2, 3, 4, 5, 6, 7, 8, 9, 10],
    "Exam_Scores": [50, 55, 60, 65, 70, 75, 80, 85, 90, 95]
}

# Create a DataFrame
df = pd.DataFrame(data)

# Visualize the relationship using a scatter plot
plt.figure(figsize=(8, 5))
sns.scatterplot(x=df["Study_Hours"], y=df["Exam_Scores"])
plt.title("Relationship Between Study Hours and Exam Scores")
plt.xlabel("Study Hours (Independent Variable)")
plt.ylabel("Exam Scores (Dependent Variable)")
plt.show()

# Calculate correlation between variables
correlation = df["Study_Hours"].corr(df["Exam_Scores"])
print(f"Correlation coefficient: {correlation:.2f}")
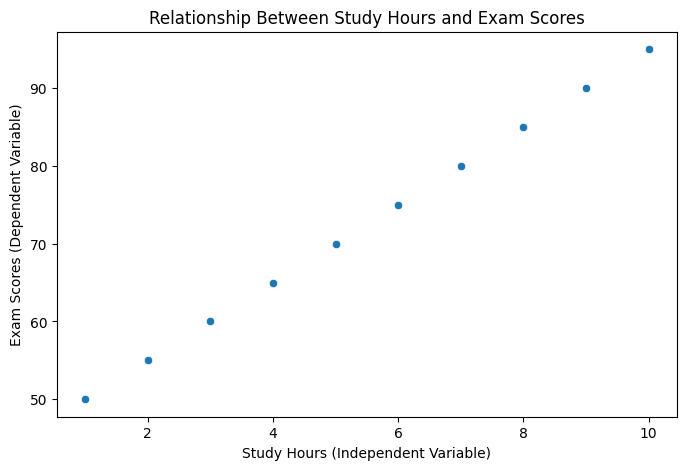
Correlation coefficient: 1.00
Tasks to Try:
Modify the dataset to include more variables, such as “Sleep Hours” and “Social Media Usage.”
Perform linear regression to analyze the relationship between independent and dependent variables.
Calculate summary statistics (mean, median, standard deviation) for each variable.
Use Python to identify potential outliers in the data.
# Your code here
8. Correlation vs. causation#
Understanding the difference between correlation and causation is crucial in data analysis to avoid incorrect conclusions.
Correlation:
A statistical measure that describes the strength and direction of a relationship between two variables, but it does not imply one causes the other.Examples:
Ice cream sales and drowning incidents (both increase in summer, but one does not cause the other).
Hours of study and exam scores (positive correlation but other factors may be involved).
Causation:
A cause-and-effect relationship where a change in one variable directly results in a change in another.Examples:
Smoking causes lung cancer (proven through controlled studies).
Exercise reduces the risk of heart disease.
Why is it important?#
Correlation helps in identifying relationships between variables but requires further analysis to determine causation.
Understanding causation is essential for decision-making in fields like medicine, economics, and business.
Misinterpreting correlation as causation can lead to faulty conclusions and ineffective policies.
Key Differences:#
Aspect |
Correlation |
Causation |
|---|---|---|
Definition |
Measures the relationship between two variables. |
Indicates a direct cause-and-effect relationship. |
Directionality |
No assumption of causality. |
Implies a one-way influence between variables. |
Example |
More sleep correlates with better productivity. |
Proper sleep causes improved cognitive function. |
Common Pitfalls:#
Spurious Correlation: When two variables appear related but are actually influenced by a third factor.
Reverse Causation: When causation is mistakenly assumed in the wrong direction.
📝 Exercises for Practice#
1. Multiple Choice Questions
What is the primary distinction between correlation and causation?
A) Correlation implies causation
B) Causation implies correlation
C) Correlation measures relationships, while causation establishes a direct effect
D) Correlation measures cause and effect relationships
Answer: C
Which of the following is an example of causation?
A) An increase in ice cream sales is associated with an increase in drowning incidents
B) More hours spent exercising reduces body fat
C) More sales lead to higher marketing expenses
D) Higher shoe sizes are associated with better reading skills in children
Answer: B
If a study finds that students who drink more coffee tend to score higher on exams, which conclusion can be drawn?
A) Drinking coffee causes better exam scores
B) There is a correlation, but causation cannot be determined
C) Studying less causes higher exam scores
D) Coffee consumption reduces stress
Answer: B
What is a spurious correlation?
A) A real causal relationship between two variables
B) A relationship that exists due to chance or a third variable
C) A perfectly linear relationship between two variables
D) A correlation that implies causation
Answer: B
Which of the following could be a result of misinterpreting correlation as causation?
A) Implementing ineffective policies
B) Increasing sample sizes
C) Using better data visualization techniques
D) Improving the accuracy of predictions
Answer: A
2. True or False
A correlation of 0.9 between two variables means that one variable causes the other.
FalseReverse causation occurs when the cause and effect are mistakenly assumed in the wrong direction.
TrueIf two variables have no correlation, it means there is no causal relationship between them.
FalseControlled experiments can help establish causation.
TrueCausation always implies a strong correlation.
False
3. Short Answer Questions
Explain the difference between correlation and causation with an example.
What is a spurious correlation, and how can it mislead data analysts?
Provide a real-world example where correlation was mistaken for causation and led to incorrect conclusions.
How can researchers establish causation instead of just correlation?
Why is it important to distinguish between correlation and causation in policy-making?
4. Application-Based Questions
A study finds a strong positive correlation between the number of hours spent playing video games and academic performance. How would you approach this result?
A company notices a correlation between the number of ads shown and revenue generated. What steps should they take before concluding causation?
How would you design an experiment to determine if eating breakfast causes higher productivity at work?
If ice cream sales and crime rates both rise during the summer months, how would you explain this relationship using correlation and causation concepts?
An analyst finds that cities with more libraries tend to have higher literacy rates. What factors should be considered before assuming causation?
5. Critical Thinking Exercise
Consider the following scenario:
A health researcher observes that people who consume more fruits and vegetables tend to have lower rates of heart disease.
Questions to discuss:
Does this observation imply causation? Why or why not?
What confounding variables might be influencing this relationship?
What additional data or analysis would you need to establish causation?
How could an experimental study be designed to determine if the relationship is causal?
Why might policymakers want to be cautious when interpreting this correlation?
6. Python Usage Examples#
Python can be used to analyze and visualize relationships between variables. Below is an example:
import pandas as pd
import numpy as np
import matplotlib.pyplot as plt
import seaborn as sns

# Sample dataset
data = {
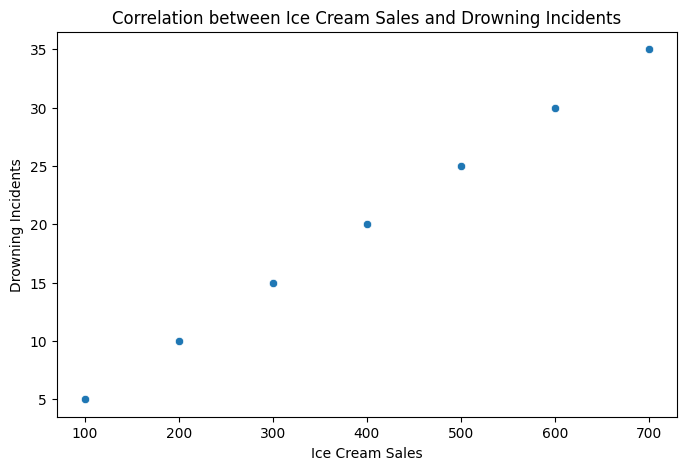
    "Ice_Cream_Sales": [100, 200, 300, 400, 500, 600, 700],
    "Drowning_Incidents": [5, 10, 15, 20, 25, 30, 35],
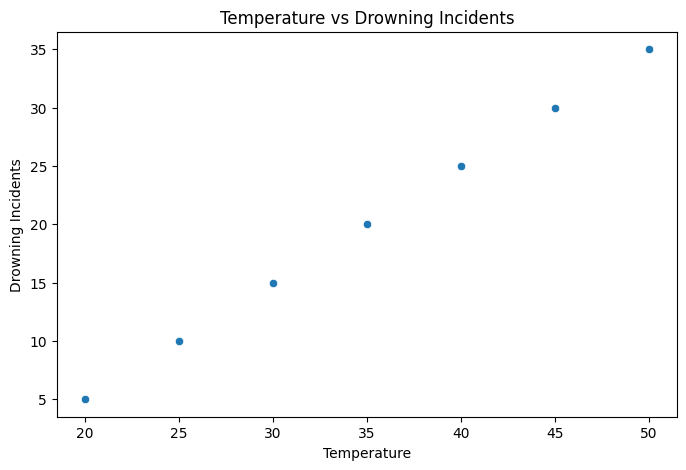
    "Temperature": [20, 25, 30, 35, 40, 45, 50]
}

df = pd.DataFrame(data)

# Scatter plot showing correlation
plt.figure(figsize=(8,5))
sns.scatterplot(x=df["Ice_Cream_Sales"], y=df["Drowning_Incidents"])
plt.title("Correlation between Ice Cream Sales and Drowning Incidents")
plt.xlabel("Ice Cream Sales")
plt.ylabel("Drowning Incidents")
plt.show()

# Calculate correlation matrix
correlation_matrix = df.corr()
print("Correlation Matrix:\n", correlation_matrix)

# Checking for spurious correlation by controlling for temperature
plt.figure(figsize=(8,5))
sns.scatterplot(x=df["Temperature"], y=df["Drowning_Incidents"])
plt.title("Temperature vs Drowning Incidents")
plt.xlabel("Temperature")
plt.ylabel("Drowning Incidents")
plt.show()
Correlation Matrix:
                     Ice_Cream_Sales  Drowning_Incidents  Temperature
Ice_Cream_Sales                 1.0                 1.0          1.0
Drowning_Incidents              1.0                 1.0          1.0
Temperature                     1.0                 1.0          1.0
Tasks to Try:
Add another variable such as “Sunscreen Sales” and analyze its correlation with ice cream sales and drowning incidents.
Use linear regression to explore relationships between variables.
Identify potential confounding variables using Python statistical tools.
Create a visualization to show how correlation does not imply causation.
# Your code here
9. Summary:#
In this notebook, we covered the fundamental concepts necessary to understand statistics, including:
Data and Experimental Units: Defined how data is collected and analyzed in statistical studies.
Population vs. Sample: Explained why working with samples is often more practical than studying entire populations.
Bias and Its Types: Discussed different types of bias (e.g., selection bias, response bias) and how they can distort statistical analysis.
Descriptive vs. Inferential Statistics: Highlighted their differences and roles in summarizing data versus making predictions.
Parameters vs. Statistics: Defined key statistical measures used in data analysis.
Types of Data: Differentiated between categorical, numerical, ordinal, interval, ratio, and time series data.
Levels of Measurement: Explained why understanding measurement scales is essential for choosing the right statistical methods.
Variables in Statistics: Covered independent, dependent, and confounding variables and their significance in research.
By mastering these foundational concepts, you are now better prepared to explore more advanced statistical methods and applications.
10. Next steps:#
Now that we have a solid understanding of basic statistical terminology, the next section will focus on Descriptive Statistics, where we will:
Learn about measures of central tendency (mean, median, and mode).
Explore variability measurements (range, variance, and standard deviation).
Understand skewness and kurtosis and how they help describe data distributions.
Use data visualization techniques to summarize and interpret datasets effectively.
These concepts will allow us to summarize datasets meaningfully and serve as a foundation for further statistical analysis.
